Article Text

Abstract
Background Seasonal changes in cardiovascular disease (CVD) risk factors may be due to exposure to seasonal environmental variables like temperature and acute infections or seasonal behavioural patterns in physical activity and diet. Investigating the seasonal pattern of risk factors should help determine the causes of the seasonal pattern in CVD. Few studies have investigated the seasonal variation in risk factors using repeated measurements from the same individual, which is important as individual and population seasonal patterns may differ.
Methods The authors investigated the seasonal pattern in systolic and diastolic blood pressure, heart rate, body weight, total cholesterol, triglycerides, high-density lipoprotein cholesterol, C reactive protein and fibrinogen. Measurements came from 38 037 participants in the population-based cohort, the Tromsø Study, examined up to eight times from 1979 to 2008. Individual and population seasonal patterns were estimated using a cosinor in a mixed model.
Results All risk factors had a highly statistically significant seasonal pattern with a peak time in winter, except for triglycerides (peak in autumn), C reactive protein and fibrinogen (peak in spring). The sizes of the seasonal variations were clinically modest.
Conclusions Although the authors found highly statistically significant individual seasonal patterns for all risk factors, the sizes of the changes were modest, probably because this subarctic population is well adapted to a harsh climate. Better protection against seasonal risk factors like cold weather could help reduce the winter excess in CVD observed in milder climates.
- Epidemiology
- season
- cardiovascular diseases
- risk factors
- cold climate
Statistics from Altmetric.com
Introduction
Seasonal variations in cardiovascular disease (CVD) mortality1 and coronary heart disease events2 are well known, but the mechanisms underlying the seasonal patterns are not fully understood.3 There are strong associations between short-term exposures to specific environmental and behavioural triggers and acute CVD events.4 Environmental exposures, like temperature and acute infections, and behavioural factors, like physical activity and eating heavy meals, have a seasonal pattern.3 ,4 Such exposures may cause arrhythmia, acute ischaemia, plaque disruption and thrombosis through changes in cardiac electric stability, vasoconstriction and coagulation, leading to sudden cardiac death, stroke or myocardial infarction (MI).4 Investigating the seasonal pattern of CVD risk factors could help determine causes of the seasonal pattern in CVD events.
An individual's seasonal risk factor pattern can be quite different from the population seasonal pattern.5 A large variation in individual seasonal patterns will reduce the population seasonal pattern, implying that important changes in CVD risk factors might be missed when using data at a population level. Most studies investigating seasonal variations in CVD risk factors were cross sectional, and few used repeated measurements in individuals.6 ,7 The Tromsø Study, a population-based cohort study with repeated measurements of CVD risk factors during more than 3 decades, is a valuable data set for adding to the scarce literature on individual seasonal patterns of CVD risk factors. In this subarctic population, we observed a small increase in MI incidence during the darkest winter months8 and, in the older people, after cold temperatures and heavy snowfall.9 This study extends our previous work by describing seasonal variations in CVD risk factors.
Methods
Study population
Tromsø has 70 000 inhabitants and is the regional centre of North Norway. The city is situated 400 km north of the Arctic Circle at 69° N and has a dark winter season from mid-November to mid-January and a summer season with 24 h daylight from mid-May to mid-July. Tromsø's seasons are: winter, 6 November to 13 April; spring, 14 April to 22 June; summer, 23 June to 18 August; and autumn, 19 August to 5 November.10 The Tromsø Study is a single-centre population-based prospective study. The study design includes six health surveys (Tromsø 1: 1974, Tromsø 2: 1979–1980, Tromsø 3: 1986–1987, Tromsø 4: 1994–1995, Tromsø 5: 2001–2002 and Tromsø 6: 2007–2008) to which total birth cohorts and random samples of the Tromsø population were invited (table 1). Response rates were between 66% and 85%. A total of 40 051 men and women participated. The surveys were conducted by the University of Tromsø, in cooperation with the National Health Screening Service (Tromsø 2–5). For the Tromsø 4–6 surveys, a subset of participants were invited for a second and more extensive screening (visit 2) a few weeks later. Details on the Tromsø Study sample and measurements are described elsewhere.11 For this study, we excluded data from the first survey (n=992) because of inconsistencies in measurement methods compared with later surveys. Furthermore, we excluded subjects younger than 20 years (n=785), subjects who did not consent to research (n=224), subjects with missing attendance date in 1979–1980 (n=6) and subjects who attended without an invitation in 1986–1987 (n=7). This left 38 037 participants for analysis, of whom 41% had at least three and 28% had between four and eight repeated risk factor measurements. Approvals were obtained from the Regional Committee for Medical and Health Research Ethics, the Data Inspectorate and the Directorate of Health and Social Affairs in Norway.
Year of examination, birth year, number and participation percentage, the Tromsø Study 1979–2008
Cardiovascular risk factor measurements
Each survey used a standardised protocol including physical examination, blood sampling and administration of questionnaires, and the methods for all the five surveys were almost identical. We examined seven traditional CVD risk factors: systolic and diastolic blood pressure (millimetre of mercury), heart rate (beats per minute), body weight (kilograms), total cholesterol (millimoles per litre), high-density lipoprotein (HDL) cholesterol (millimoles per litre) and triglycerides (millimoles per litre). We also examined two acute-phase proteins associated with CVD: C reactive protein (CRP) (milligrams per litre) and fibrinogen (grams per litre), measured only in a subset of participants in Tromsø 4, 5 and 6. Blood pressure and heart rate were measured with an automatic device in all surveys except Tromsø 2 where a mercury sphygmomanometer was used. To adjust for this change in method, recordings were transformed in accordance with validated methods.12 Three readings in Tromsø 3–6 and two readings in Tromsø 2 were recorded with 1 min interval, and the mean of the two final recordings were used in the analysis. Weight was measured to the nearest half kilogram with subjects wearing light clothing and no shoes. Non-fasting blood samples were analysed by standard methods at the Department of Laboratory Medicine, University Hospital of North Norway. Details on data collection have been described elsewhere for Tromsø 2, 3 and 4,13 Tromsø 514 and Tromsø 6.15 Because of summer vacation, no measurements were performed in July.
Meteorological data
Meteorological data were collected from the official web page of the Meteorological Institute of Tromsø from January 1979 to December 2008.16 Due to very low levels of air pollution in Tromsø, we did not include such data in our analysis.
Statistical analysis
All risk factors were approximately normally distributed except triglycerides and CRP, which had a positively skewed distribution and so were log transformed prior to analyses. High CRP levels are likely to be caused by acute infections or underlying inflammatory conditions, and some17 but not all18 studies investigating seasonal patterns in inflammatory markers excluded CRP concentrations >10 mg/l. Therefore, for the analyses of CRP and fibrinogen, separate analyses excluding CRP levels >10 mg/l were performed.
We used linear regression models with the risk factor in question as the dependent variable and independent variables of age, sex and 11 indicator variables for month. This gave the monthly risk factor means adjusted for age and sex. We modelled seasonality by assuming a sinusoidal seasonal pattern and allowed this to vary at an individual level using a random effects model (random sinusoidal seasonal terms for each subject). We fitted models with and without the random seasonal terms and compared their fit using the Akaike Information Criterion. The model without the random seasonal terms (population model) assumes that every individual has the same seasonal pattern. Therefore, a large improvement in model fit after adding the random seasonal terms (individual model) tells us that some individuals vary from the population seasonal pattern. The sinusoidal seasonal pattern was fitted using cosine and sine terms based on the date of screening and assuming one cycle per year (known as a cosinor model). For each risk factor, we plotted the population seasonal pattern, used circular density plots of the estimated individual phases to show the variation in the timing of the seasonal peak and used histograms of the individual amplitudes to show the variation in the height of the seasonal peak. The histograms of individual amplitudes had skewed distributions, so we used the median and IQR as summary statistics. A statistical test for seasonality at the population level was made by comparing the fit of models with and without seasonal terms as fixed effects using a χ2 test. An individual level test of seasonality was made by comparing models with and without random effects for season for each subject.
All models included a random intercept for each subject to model constant differences between subjects (eg, overweight vs underweight subjects). Fixed effects for age, sex and survey number were included to control for changes in CVD risk factors with age, between men and women, and over time, respectively. We found no association between month of year and day of week or time of day for the examination time, which was investigated to rule out the possible confounding by circadian or weekly variation in CVD risk factors. As a sensitivity analysis, all models were stratified by sex.
The monthly mean of daily mean, minimum and maximum temperatures (degrees Celsius), sun hours (hours) and maximum snow cover on ground (centimetres) were included as descriptive data to allow seasonal comparisons with other geographical areas.
Statistical analyses were performed using R V.2.14.1 (http://www.r-project.org) using the lme4, circular and season packages.
Results
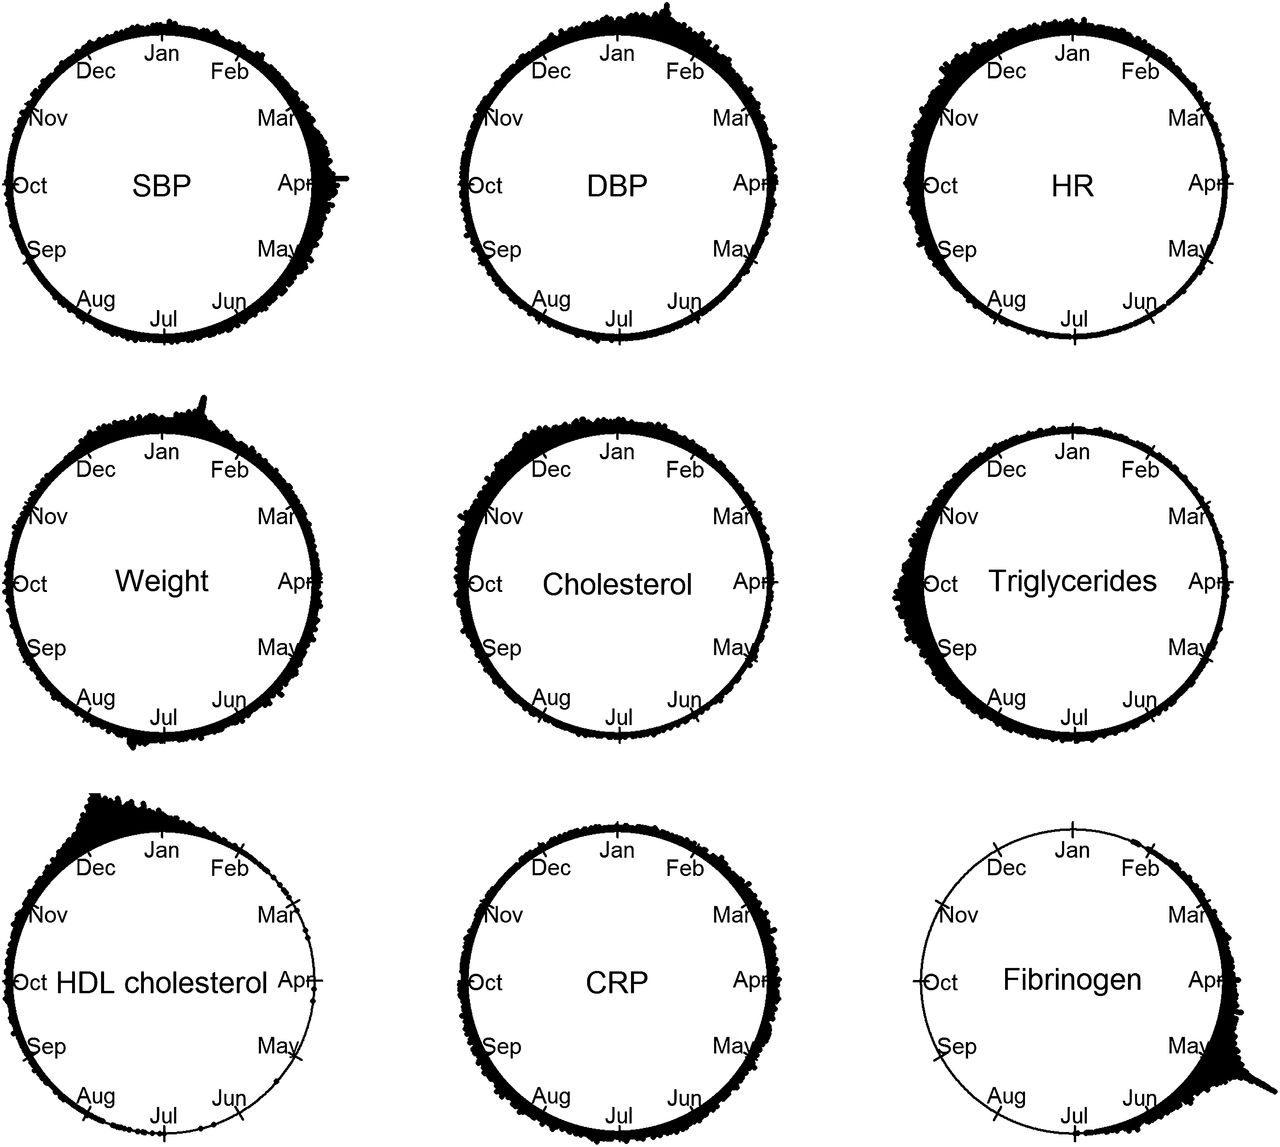
The variations in monthly means of CVD risk factors were very modest despite large seasonal variations in climate factors such as snowfall and daylight (table 2). The estimated individual phases (peak time point) and individual amplitudes (size of the seasonal change) showed highly statistically significant seasonal patterns for all CVD risk factors (table 3). Circular plots of the estimated phases for the individuals for CVD risk factors demonstrated that all risk factors had their peak time in winter, except for triglycerides, which peaked in autumn, and CRP and fibrinogen, which peaked in spring (figure 2). Cosinor plots of the population seasonal patterns and histograms of individual amplitudes for all risk factors are in the online-only material, figure 1.
Monthly mean values for cardiovascular disease risk factors adjusted for age and sex and estimated for age 50 and for meteorological data, the Tromsø Study 1979–2008
Estimated seasonal phase as calendar days and amplitude for cardiovascular disease risk factors, adjusted for sex and age, with median and IQR, and p value for test of seasonality at population and individual levels, the Tromsø Study 1979–2008
The phase and amplitude in the cosinor curve are exemplified by systolic blood pressure in figure 1. Systolic (figure 1) and diastolic blood pressure had their phases in late March and mid-January, respectively (table 3, figure 2). Diastolic blood pressure had a narrower phase IQR, indicating less individual variation around the population seasonal pattern. The heart rate phase was in early winter (table 3, figure 2). The seasonal variations in blood pressure and heart rate were statistically significant, but the amplitudes were clinically small (table 3), representing a maximum seasonal variation of 2 mm Hg for systolic and 1 mm Hg for diastolic blood pressure, and <1.5 bpm for heart rate.

Seasonal variation in systolic blood pressure (in millimetre of mercury): cosinor plot explaining amplitude (ie, the size of the seasonal change from the individual mean) and phase (ie, the peak time point). The Tromsø Study 1979–2008.

Seasonal variation in cardiovascular risk factors: circular plots of the individual phase (ie, density plot of the estimated individual variation in the timing of the seasonal peak) for systolic blood pressure (SBP) and diastolic blood pressure (DBP), heart rate (HR), body weight, total cholesterol, triglycerides, high-density lipoprotein (HDL) cholesterol, C reactive protein (CRP) and fibrinogen, adjusted for sex and age. The Tromsø Study 1979–2008.
For blood lipids, the most evident seasonal pattern was for HDL cholesterol with the mean phase on 10 December and a narrow phase IQR in the first part of December (table 3, figure 2). The narrow phase IQR indicates little individual variation from the population seasonal pattern. Total cholesterol peaked in late November with a range from late autumn till the darkest winter period (table 3, figure 2), while triglycerides peaked in mid-autumn (table 3, figure 2). Though highly statistically significant, the amplitudes of all blood lipids were small (table 3). Weight had its phase in January with a wide IQR from late December to early May (table 3, figure 2) and an amplitude of half a kilogram representing a maximum seasonal variation of 1 kg (table 3).
Individuals' fibrinogen level had a seasonal pattern with the phase in early spring, with a narrow IQR of less than a month (table 3, figure 2). When excluding fibrinogen measurements that had CRP measured at the same date and where those CRP levels were >10 mg/l, the phase moved to late February and the width of the IQR became six times as large (table 3). The seasonal change in fibrinogen level was statistically significant but clinically small (table 3). For CRP (table 3, figure 2), analysis with and without CRP levels >10 mg/l had the phase in May and June, respectively, with a wide IQR from late winter to late summer and early autumn, the amplitude was small, and the seasonality test was only significant for the individual model (table 3).
Results from the sex-stratified analysis were similar for all risk factors with regard to phase, amplitude and seasonality tests, except for weight for women, which was significant only for the individual model, and fibrinogen for men, which was significant only in the population model for all values and in the individual model for non-pathological values (online-only material, tables 1 and 2).
Discussion
We found highly statistically significant individual seasonal patterns for all CVD risk factors with peak times in winter for all risk factors, except for triglycerides, which peaked in autumn, and CRP and fibrinogen, which peaked in spring. The seasonal variations in all risk factors were clinically modest.
Haemodynamics
Cold temperatures may increase haemodynamic factors like blood pressure and heart rate through activation of the sympathetic nervous system, which can lead to stroke or MI or sudden cardiac death through plaque rupture and thrombosis.4 Previous studies reported of increased systolic6 ,19–22 and diastolic6 ,22 blood pressure in winter or at cold temperatures. This is supported by our findings, as the period early November to mid-April is considered to be the meteorological wintertime in Tromsø (table 2). Amplitudes for systolic blood pressure were similar to those in a study of repeated measurements among some 150 000 adults in Austria6 but smaller than those reported from cities closer to equator.19 Our seasonal change in diastolic blood pressure was somewhat smaller than reported from Austria.6 Heart rate levels in Tromsø peaked in early winter. Higher blood pressure in cold temperatures with no coinciding increase in heart rate has been reported previously.20
Blood lipids and body weight
The sizes of the winter increase or amplitude in total cholesterol and HDL cholesterol in the present study were similar to, while the amplitude for triglycerides was lower than in the Massachusetts-based SEASONS Study7 of 476 adults with repeated measurements through a year. The Austrian study as well as small-scale studies from central Europe observed larger winter versus summer changes of cholesterol6 ,23 and triglyceride23 levels compared with our study and lower HDL cholesterol in winter compared with summer.23 ,24
Nutrition data were not included in our study and we can therefore only speculate on reasons for the seasonal changes in blood lipids and body weight. The short period of elevated winter levels of HDL cholesterol coincides with increased intake of alcohol25 before and during the Christmas holidays. The size of the winter increase in body weight in our study is similar to that from the SEASONS Study, which also found a coinciding seasonal intake of calories and fat, as well as reduced physical activity during winter.26
Inflammatory markers
For fibrinogen, we observed a small amplitude and narrow phase IQR when winter turns to spring, and when excluding observations of pathological CRP levels, there was a winter phase and wider phase IQR with a similar amplitude. Though inconsistencies exists,27 ,28 several studies have shown that fibrinogen levels are higher in winter or cold temperatures than in summer or warm temperatures, but as for most other investigations on seasonal patterns for CVD risk factors, these results were based on cross-sectional studies18 ,29 in subgroups of elderly people30 ,31 or post-MI patients,32 with seasonal variation amplitudes varying from 0.418 to 1.26 g/l,33 all larger than our findings.
CRP peaked later in the spring and had a wide phase IQR than had fibrinogen, also when excluding pathological CRP levels. Several,17 ,32 ,33 but not all,34 ,35 studies found higher CRP levels in winter or at cold temperatures compared with summer or warm temperatures, with seasonal amplitudes of up to 30% increase reported from 24 healthy elderly Belfast citizens measured each month through a year.33 The amplitude of CRP in the current study was close to the 9% increase reported from the SEASONS Study17 with 534 adults with two or more CRP measurements through a year.
Both acute respiratory infections and CVD events peak in winter, and acute infections are triggers of CVD events.4 ,36 Higher levels of inflammatory markers like fibrinogen and CRP during winter are associated with colder temperatures.21 ,32 Together with other risk factors increasing in winter or cold temperatures, such as increase in factor VII,28 ,31 platelet count,21 ,23 ,24 whole blood viscosity21 ,24 and decrease in plasma volume,21 this may lead to a hypercoagulate condition, which can increase the risk of a thrombotic event like sudden cardiac death, stroke or MI.4
Living in the high north
The increased levels of traditional CVD risk factors during the colder or darker winter period of the year were clinically small in this population compared with findings from other studies. The clinical effect is probably not large enough to cause a seasonal pattern in CVD events.
A marginal effect of season8 and weather9 on MI incidence and CVD risk factor levels in the Tromsø population is probably due to the combination of high living standards and long-time climate-adaptive behavioural protection like wearing adequate clothing when being outdoors1 ,37 and having well-insulated buildings with throughout-the-year warm and stable indoor temperatures.38 ,39 Better protection against cold weather could prevent the winter excess in CVD and coronary heart disease mortality,1 all-cause mortality1 ,38 ,40 and seasonal variation in CVD risk factors,19 observed in milder climates.
Strengths
Our study is based on repeated measurements in a large population-based cohort of all adult ages, while the main body of knowledge in this area hitherto was based on cross-sectional studies. Cross-sectional studies will always underestimate the size of the seasonal change in risk factors when there is individual variation in the timing of the peak.5 This is because individual seasonal patterns can be cancelled out when examining the population average. For example, if half the population had a seasonal peak in winter and half in summer, then the population seasonal pattern would look flat. Examining individual seasonal variation is therefore the key for understanding the seasonal changes in risk.
Limitations
A large number of subjects contributed with only a single measurement, with varying number of measurements per risk factor. There was a lack of measurements in July. Using sinusoidal methods has the assumption of a symmetric peak and trough and does not allow other possible seasonal patterns (eg, a seasonal pattern with a sharp increase in autumn and steady decline in spring and summer).
Conclusions
In this subarctic population, we found highly statistically significant seasonal patterns with increases in traditional CVD risk factors in colder or darker periods. However, the magnitude of the seasonal differences is likely too small to contribute to acute CVD events. The relatively small changes are probably because the population of Tromsø is well adapted to a harsh climate, as better protection to seasonal influences may prevent winter excess of in CVD events.
What is already known on this subject
-
The main body of knowledge on seasonal variation in CVD risk factors is based on cross-sectional studies. A key factor for understanding the seasonal changes in risk is to investigate individual seasonal patterns from repeated measurements in population-based studies.
-
The effect of season might be dependent on the local climate. There is a lack of studies on seasonal patterns in risk factors from cold climate areas.
What this study adds
-
The winter increase in traditional CVD risk factors in this subarctic population was small compared with findings from other geographical areas, probably because of the extensive climate-adaptive behavioural protection in clothing and housing standard.
-
Improvement in such protection could prevent the winter excess in cardiovascular morbidity and mortality observed in milder climates.
References
Supplementary materials
Supplementary Data
This web only file has been produced by the BMJ Publishing Group from an electronic file supplied by the author(s) and has not been edited for content.
Files in this Data Supplement:
- Data supplement 1 - Online tables and figures
Footnotes
-
Competing interests None.
-
Ethics approval Ethical approval was provided by the Regional Committee for Medical and Health Research Ethics, the Data Inspectorate and the Directorate of Health and Social Affairs in Norway.
-
Provenance and peer review Not commissioned; externally peer reviewed.